Instructional observation data has long been reserved for evaluation, relegated to one post-observation conference and then a summative evaluation. We believe that taking this data out of the box and putting it in front of teachers in real time can empower them to own their growth in new and revolutionary ways.
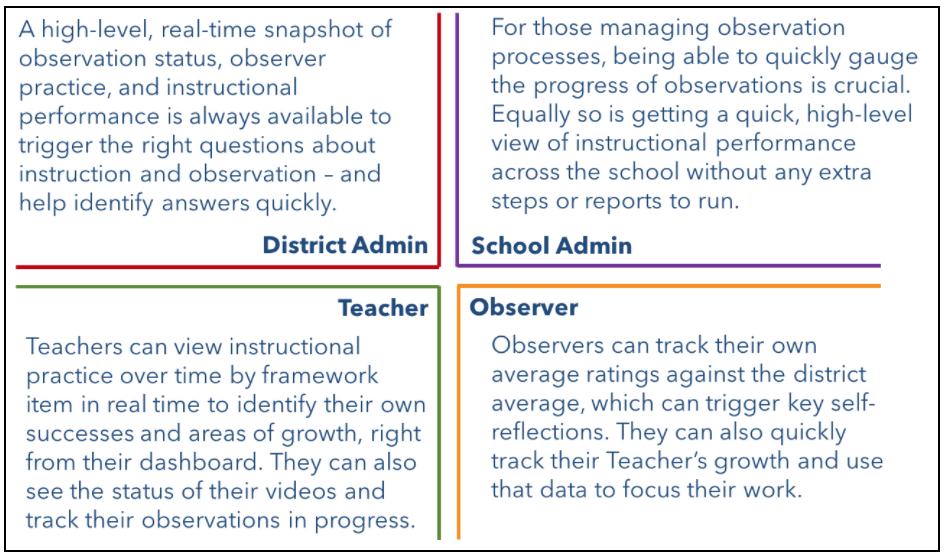
We’re excited to announce the launch of powerful real-time data and data management features to complement our ADVANCEfeedback® product. Let’s take a look at how these newly released Data Display features can be used to inform choices at every level of stakeholder engagement.
Driving Instructional Practice for Teachers
Straight from their ADVANCEfeedback dashboards, teachers can view their instructional practice over time by framework item. This data is displayed in real time to support the identification of personal successes and areas of growth.
Teachers now have access to two dashboards:
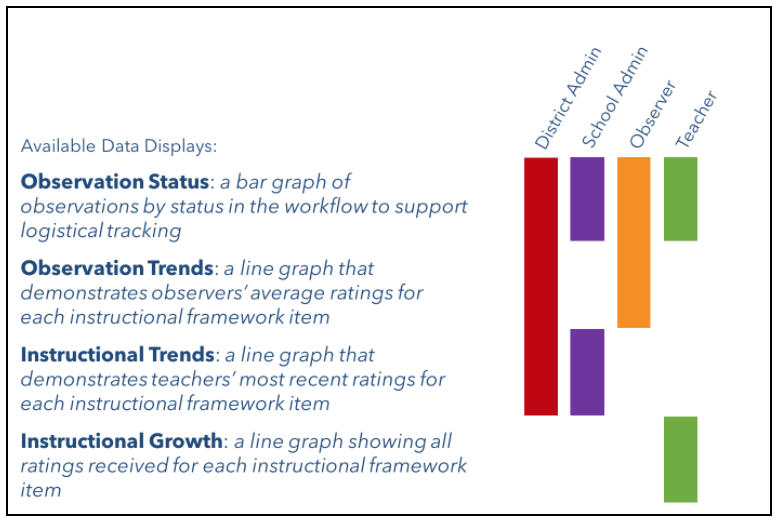
- Observation Status: A bar graph of observations by status gives teachers a clear picture of where their observations are in the process. They can quickly see how many videos they’ve shared with peers, submitted to their observer, and on which they’ve received feedback.
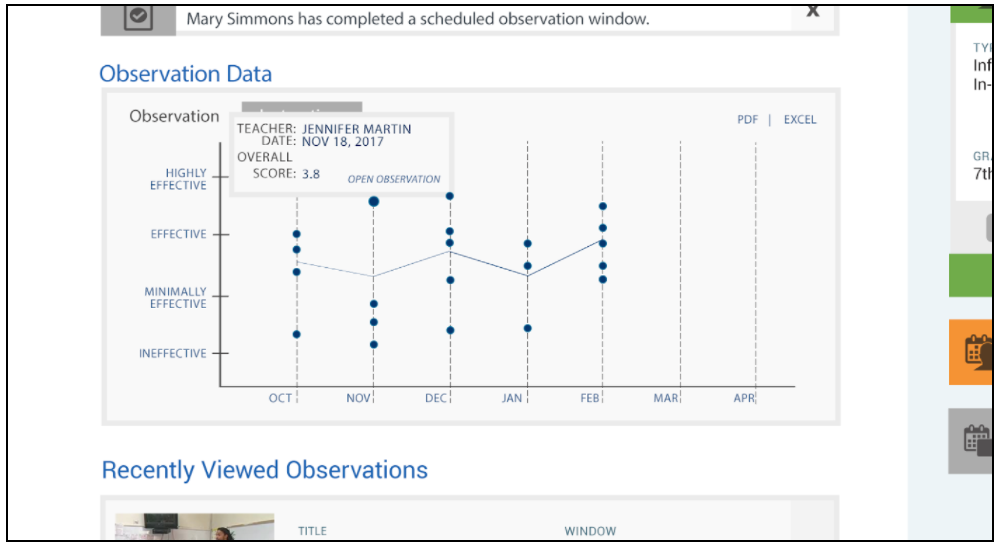
- Instructional Growth: This line graph displays the ratings that teachers have received by instructional framework item. The display makes it easy for teachers to see which area of their instructional framework they are mastering, and which could use additional focus. The data can be submitted formally or informally—and the more data points the better!
Supporting Targeted Feedback for Observers
Observers also now have quick access to two graphs on their data display. This allows them to track their average ratings against the district average, supporting self-reflections and raising key questions. They are also able to see an overview of their teachers’ growth and use that data to focus their feedback.
The two graphs presented to Observers are:
- Observation Trends: Being able to quickly see how their average ratings align with the average ratings across other observers in their school or district can highlight many important trends. Is an observer consistently rating higher than their peers? This could indicate that their teachers are outperforming, or that, as the observer, they have drifted from the observational norm. While this data may not provide answers immediately, it gives a great starting point for observer self-reflection.
- Observation Status: Just like teachers, observers see a bar graph of observations by status to give them a clear picture of where their observations are in the process. They can quickly see how many videos they’ve been assigned, started observing, or completed.
Enabling Effective Professional Development Decisions for Administrators
For those managing teacher growth processes, easy access to a high-level view of instructional performance across a school or district can inform professional development investments at the individual or collective level. This ensures effective resource management and that the right questions are being asked. Also, with one click, users can download the raw data behind each table—in an easy-to-manipulate format—and dig in to answer any questions or explore the data further.
Administrators also have a higher perspective on similar tables to those of teachers and observers:
- Observation Status: Administrators can get a quick look at the status of observations in progress, ensuring that it’s easy to keep observations on track and eliminating stress around the logistics of the observation process.
- Observation Trends: Administrators can quickly see how observers’ average ratings align across a school or district. This highlights trends in both observational and instructional practice. This data provides an excellent jumping off point for asking hard questions about progress within the school or district.
- Instructional Trends: This graph gives administrators a quick visualization of how teachers are performing on each instructional framework item, quickly and easily showing where investing resources toward professional development could pack the biggest punch.
For more information about this release, please visit our latest press release.