

Sponsored content provided by Concordia University-Portland
As a former K-12 teacher, principal, and district administrator, I’ve worked with many teachers and school leaders in data analysis sessions over the past 25 years. But I’ve never met anyone who gets up in the morning and says, “I’m so excited to analyze the state test results today!”
Data analysis can cause stress, anxiety, and fatigue, which may contribute to burnout or prevent us from enjoying our work.
But data analysis doesn’t have to be drudgery; it can be uplifting, invigorating, and inviting.
Alleviating Stress and Fatigue from Data Analysis
Why do we become stressed out or tired from data analysis?
One reason is the way statewide assessments have been used to judge school districts. Stress accompanies data analysis because we worry about the results of these tests and we’re anxious about how they’ll impact our employment.
One way principals can help is to assure teachers that test results will be used reasonably and collaboratively for improvement planning. Effective principals know that non-threatening forums, such as Professional Learning Communities (PLCs), are better ways to consider trends and causes underlying the data story. Teachers can support each other in PLCs to build capacity and understanding of the data and reduce stress.
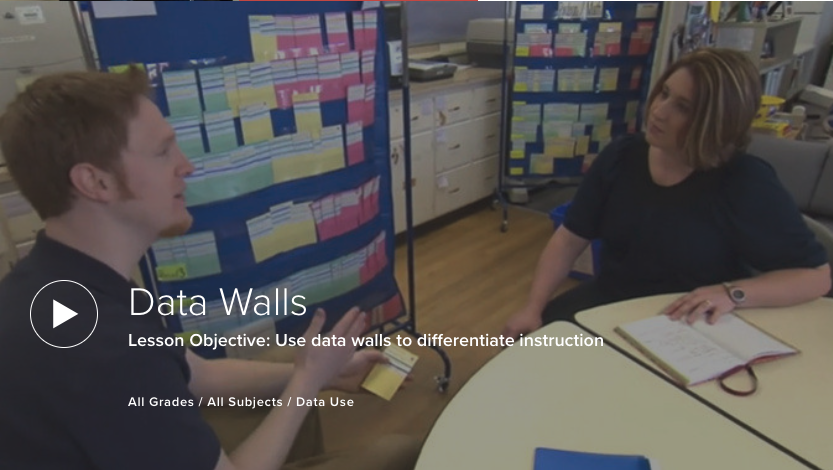
VIDEO: Data Walls
Relevance
Analyzing data can be difficult when the data is irrelevant to our work. While state assessments are required by law, they’re not an unsolvable puzzle. State departments of education, regional educational service districts, district offices, and school principals all have resources, tools, and training that can assist us in the process.
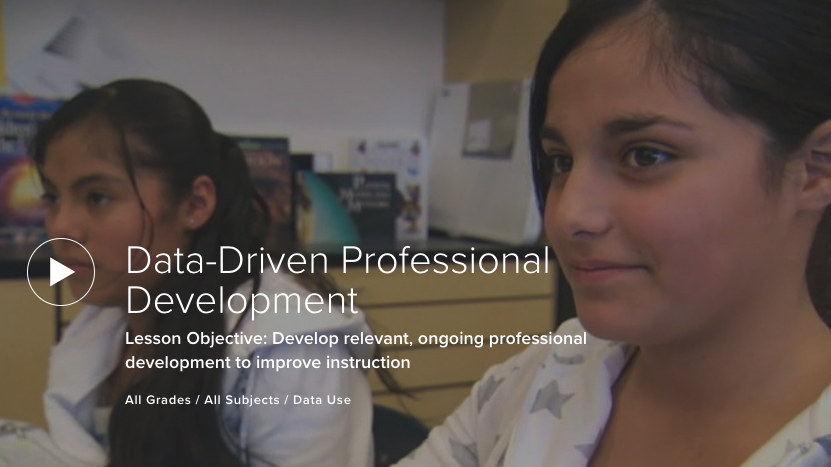
VIDEO: Data-Driven Professional Development
Knowledge and Multiple Measures of Data
We may feel anxious about analyzing data if we believe we must be statisticians or we don’t understand how the tests were designed or scored. If principals can help teachers learn the skills necessary for good data analysis, then the process becomes easier.
Data is more than just student performance data, too: It’s also school process, demographic, and perceptual data (Bernhardt, 2013). Collecting a wide variety of data to tell the story is vital to make it more engaging, understandable to parents and students, and useful for teachers.
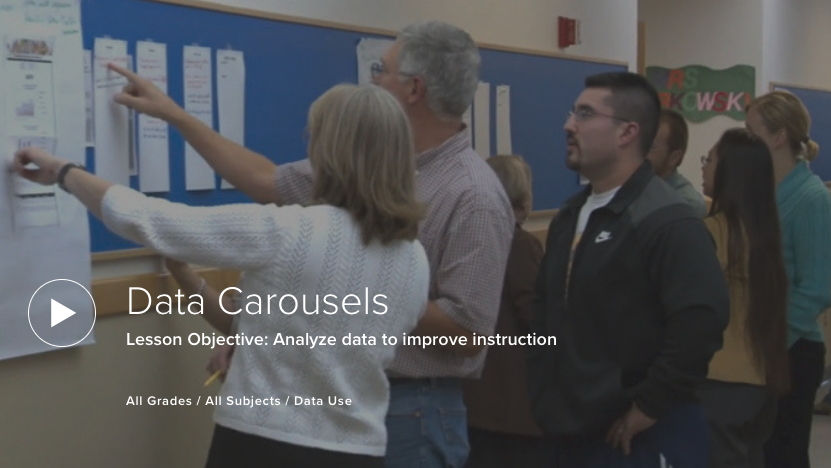
VIDEO: Data Carousels
Diagnostic and Formative Assessments
Diagnostic and formative assessments can provide meaningful and real-time data for analysis.
- Combining formative with summative results builds a data portfolio that can tell a more complete story about the school and students’ learning. It also helps with triangulation of data and looking for trends.
- Computer-adaptive tests can show students’ readiness of what to learn next and are invaluable for improving instructional practices. Having this type of knowledge reduces our stress and fatigue.
- Formative assessments can be transformative for us and our students (Popham, 2008), which can further decrease stress because we’ll see positive changes in our students’ learning as a result of our teaching.
10 Tips to Focus on Learning and Growth
- Attitude is key. Approach the problem with an inquiry mindset, curiosity, and exploration. Set aside preconceptions, biases, and anxiety.
- Tell a story with the data. Make it come alive.
- Use an organized process and be consistent. Many schools use PLCs focused on common goals.
- Make predictions, which are more than random guesses.
- Look for evidence of your predictions. If not there, do not lose heart. Discover what is present in the data and use it to define trends to tell your story.
- Collect data frequently. Keep anecdotal records, notes, journals, spreadsheets, gradebooks, surveys, quizzes, and unit tests. Multiple measures make your story more accurate and personal.
- Read and learn more about data analysis. Take a class or go to a conference. Ask a colleague, instructional coach, or mentor for ideas. Being knowledgeable gives us confidence and combats stress and fatigue.
- Acknowledge what you find, set goals, and learn from the experience.
- Remember, this is just data. It does not define who we are as individuals or professionals. If we learn how to manage and analyze data with peers, our collective confidence will help us know what to do next.
- Above all, find joy in your work. Always look for something to celebrate!
Best wishes on your data journeys!
Find out more about Concordia’s College of Education.